Plotting GridObjects#
Inbuilt Functions#
There a two ways to plot your DEMs using the provided show functions.
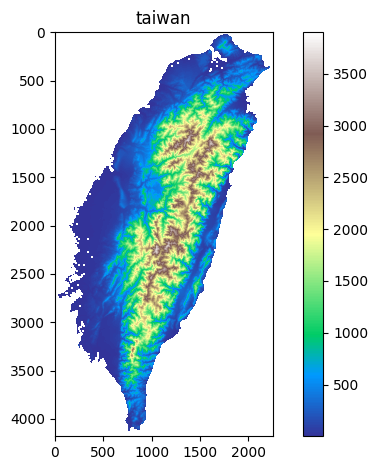
The class GridObject has the inbuilt GridObject.show(), which will plot the object using matplotlib.
To plot multiple GridObjects, use topotoolbox.show(). This util function can take multiple GridObject as arguments.
[1]:
import topotoolbox as topo
[2]:
dem1 = topo.load_dem("taiwan")
dem1.show()
[3]:
dem2 = topo.load_dem('perfectworld')

# To increase resolution use the dpi argument. Default value is 100.
topo.show(dem1, dem2)
---------------------------------------------------------------------------
AttributeError                            Traceback (most recent call last)
Cell In[3], line 4
      1 dem2 = topo.load_dem('perfectworld')
      3 # To increase resolution use the dpi argument. Default value is 100.
----> 4 topo.show(dem1, dem2)

File ~/.local/lib/python3.10/site-packages/topotoolbox/utils.py:96, in show(dpi, cmap, *grid)
     94 for i, dem in enumerate(grid):
     95     ax = axes[i]
---> 96     im = ax.imshow(dem, cmap=cmap)
     97     ax.set_title(dem.name)
     98     fig.colorbar(im, ax=ax, orientation='vertical')

AttributeError: 'numpy.ndarray' object has no attribute 'imshow'
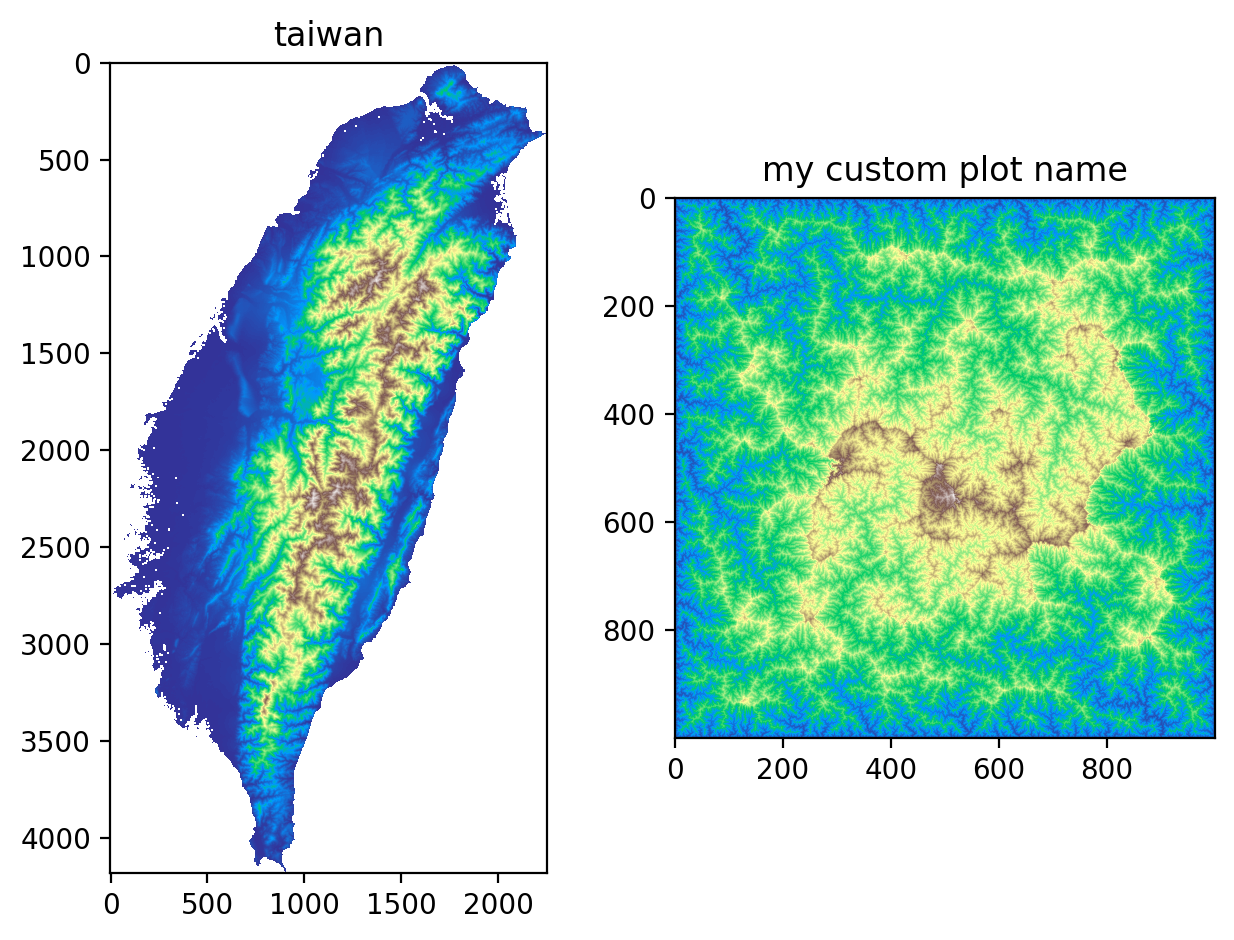
External plotting#
If you want to customize your plots, use the matplotlib library. A GridObject can be passed just like a np.ndarray when plotting.
[4]:
import matplotlib.pyplot as plt
[5]:
fig, (ax1, ax2) = plt.subplots(1, 2, dpi=200)
ax1.imshow(dem1, cmap='terrain')
ax1.set_title(dem1.name)

ax2.imshow(dem2, cmap='terrain')
ax2.set_title('my custom plot name')

plt.tight_layout()
plt.show()